Hello everyone, I’m back to report progress on the second phase of trying to diagnose, and propose optimizations for the image compression software Guetzli. If you recall in the first step, we were conducting benchmark test to see exactly what sort of performance we could get out of the program using some of the stock compiler optimization options. What we discovered was that this program is really really slow! So why is this, and also what part of the program is contributing the most to the slowdown? Well in this stage we shall find out!
Earlier this month our professor introduced us to performance monitoring tools gprof and perf to help us narrow down which program functions were taking the most time. Now between the two methods, gprof is far more through in analyzing a program but this is only possible if the program source code has a configuration script. Why is such a file relevant you ask? Well a configuration script is one way to help build a program from it’s source code. That in mind, the way gprof works is that you incorporate it’s code into the program you are testing. Therefore to accomplish this, you would need to modify that configuration scrip with a simple command in the command line. This is great as you get really accurate data, and can export it so that it displays as a very nice looking diagram.
Unfortunately, the program I am testing did not have this configuration script, so I decided to rely on the perf method instead. The silver lining to this was that I did not necessarily need to recompile my code for it to work. Now while this method is not as accurate as gprof, it still has it’s own merits, as you can not only see the C code, but the assembler code it compiles down to when run. This data can also be exported and viewed in a fairly user friendly manner as well, but only through a Linux command terminal.
Ok enough preamble, get to the results!
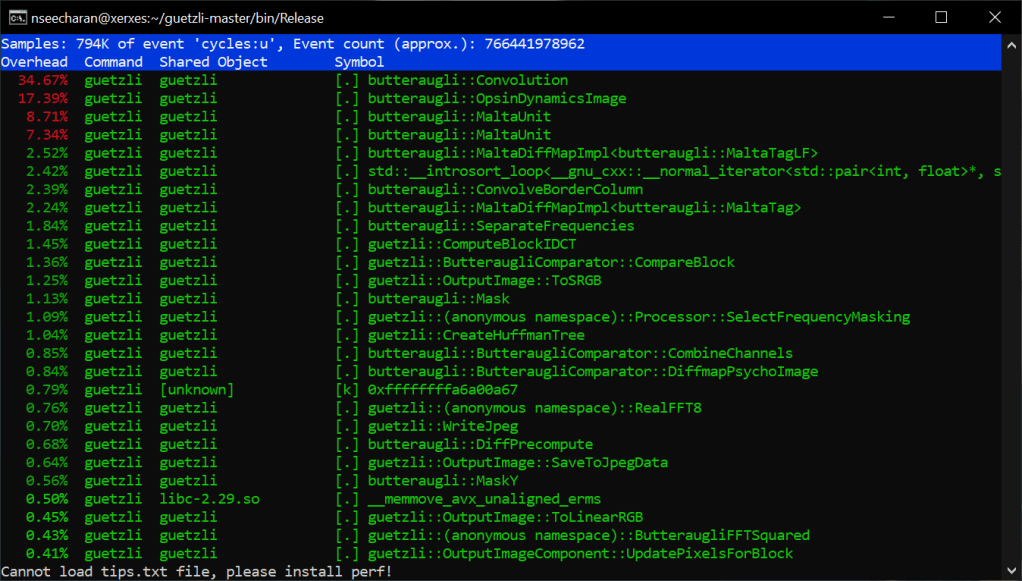
What you are seeing is a report that shows which functions of the program were taking up most of the processing time when converting a 720p image. As you can also see, I ran this test on the x86_64 machine Xerxes. I did attempt to use perf on the AArch64 machine Isreal, but perf did not seem to be installed. There were some server issues earlier in the week, so the OS might have been reinstalled. In any case, that’s something I will ask my professor about later in the week. For now though, this data will be enough for our purposes. Looking at the list it is clear that the function “Convolution” takes the most time. This makes sens seeing as convolution is actually a artificial intelligence, and image process algorithm. In the case of artificial intelligence this helps in image recognition, however in our case if I had to guess, this helps to determine where the level of detail in the image can be lowered with minimal to no appreciable difference in quality. It’s probably best you click the link I provided on convolution for more information, as it is very through. Not to mention it may even have solutions for speeding up the algorithm… It’s worth taking a look if nothing else.
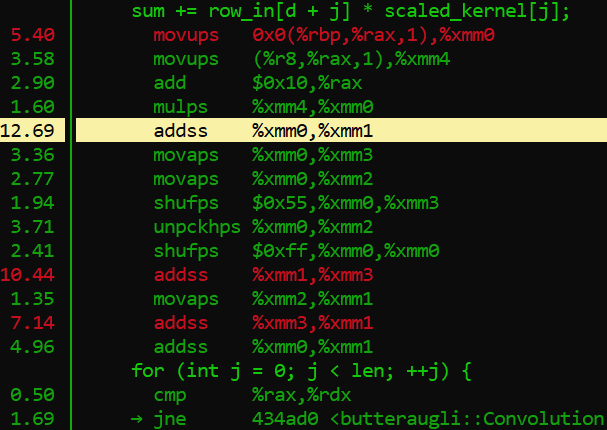
For now though, my current goal would be to speed up certain arithmetic operations with the current code, and not do focus too much on a full code rewrite. Getting back to the list here, we can actually look into the code of those functions to see the C code translated assembler code:
This is a portion of the convolution code as represented in this display, here is what he code looks like normally:
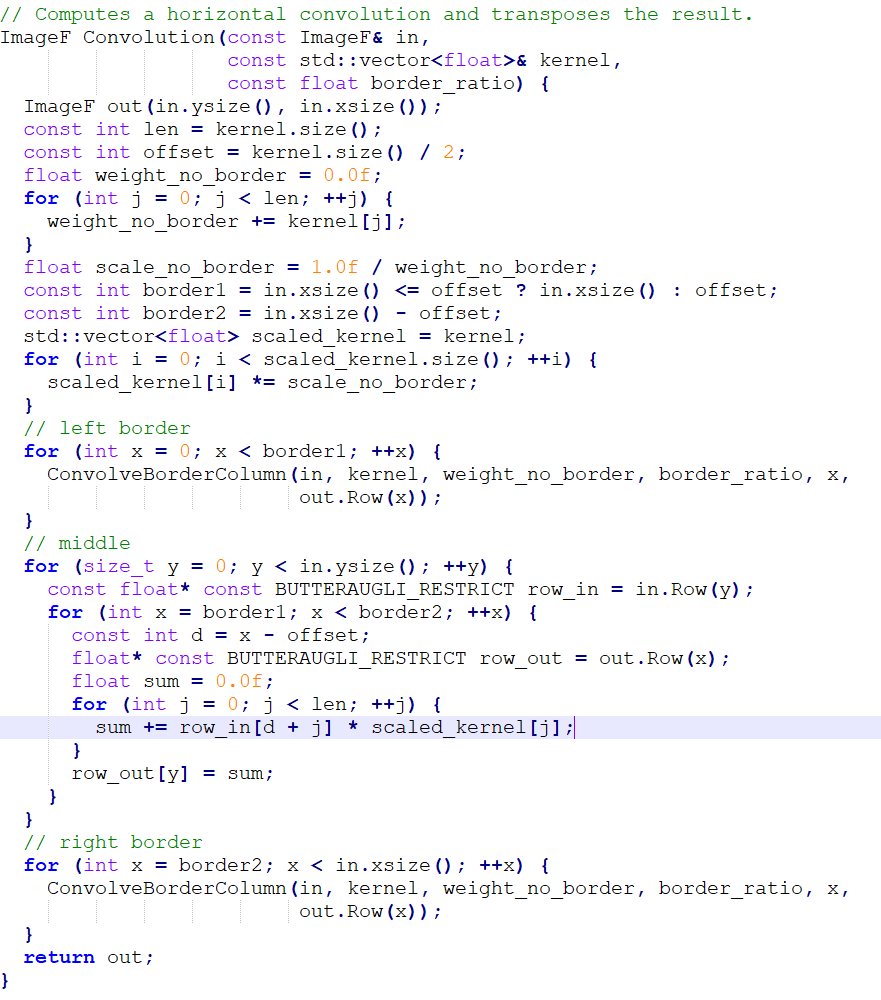
Now in the perf report we see that there is an assembler opcode operation that takes up 12.69% of the processing withing this single function. The opcode in question is “addss,” which works in a similar to the assignment operator += in conventional programming, but is specifically reserved for floating point values. Now if you look at the C++ code, you will notice that the variable “sum” is of type float, and has been initialized with a single precision floating point value, denoted with f. This is why assembler is using the addss opcode. Frankly, almost all of those assembler opcodes listed in the picture are reserved for handling floating point values. Crazy huh? Well as we have learned, decimals are very very trik… Impossible to represent literally in binary, so it is understandable that working with values like this would require quite a bit of extra processing from the cpu.
Sigh… Sum why couldn’t you grow up to be a fixed point, life would be a lot easier for you…
Well… Actually, it may be possible to apply a fixed point math approach, and potentially speed up things up as well. I recall my professor demonstrating three different approaches to adjusting the volume of a sound sample. One approach was the slow, but very accurate floating point conversion method, another that used a map of possible volume sample values, and a fixed point math approach, that managed to represent the decimal values without actually needing to do any conversions. All had their strengths and weaknesses, but if memory servers, the fixed point method managed to stay fairly accurate, and was also a bit more quick to execute.
This in mind, how I choose to go about this is still a bit up in the air. Do I just rewrite the loop in C++, or override it with inline assembler? Maybe instead I can rely on SIMD vectorization to help with looping code. In any case, I will have to research a bit more, and soon as stage 3 will need to be delivered by the 18th haha.
Well wish me luck and see you hopefully before the 18th!
